Trade Network Model (TNM)
For those cases where you are uncertain where a commodity supply is grown, CommodityMap uses the TNM (Figure A).
 Figure A: Example message appears within CommodityMap when entering a supply with unknown growing location.
The TNM (Figure B) is designed to identify potential source countries for a given commodity based only on the country in which the commodity was purchased. The model follows international trade flows back to countries that produce and export substantial quantities of the given commodity and considers broker nations, defined as those countries that import and then re-export a commodity. 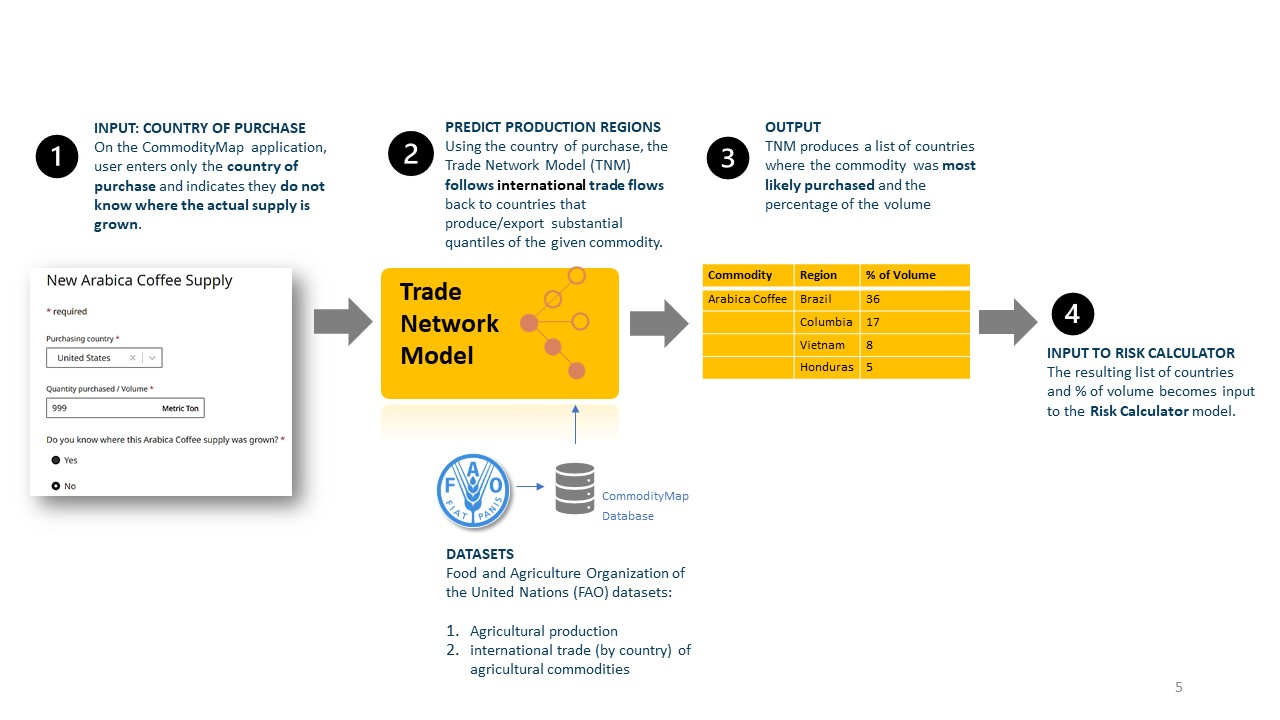 Figure B: How the Trade Network Model processes country of purchase to produce the most like countries a commodity was sourced.
[enlarge image](https://thesustainabilityconsortium.github.io/CommodityMap-Help/images/how_tnm_works.jpg) <p?> Beginning with the given commodity and purchase location (Figure B, step 1), the first step is to evaluate if this commodity was likely to have been imported or domestically produced. If the country of purchase has substantially more domestic production than imports of the commodity of choice, it is deemed domestically produced, and the analysis is over. The purchase region is the source region. Otherwise, the model will begin to build a trade network and at least part of the production regions will be deemed external to the purchase nation. To build the trade network, a graph structure is created utilizing trade statistics from FAOSTAT (Figure B, step 2 Datasets) with the purchase location being the first node in the graph, referred to as the root node. The primary data involved is FAO trade network data and FAO production data. For all major commodities, the FAO collects information on the exact number of metric tonnes that are imported and exported between all participating nations, as well as how much each nation produces domestically. Directed edges are added to this root node (directed to it) for each import record found for the purchase location and commodity given. Table 1 shows a sample of United States import records for pineapples while figure C shows the updated trade network after these import records have been added. 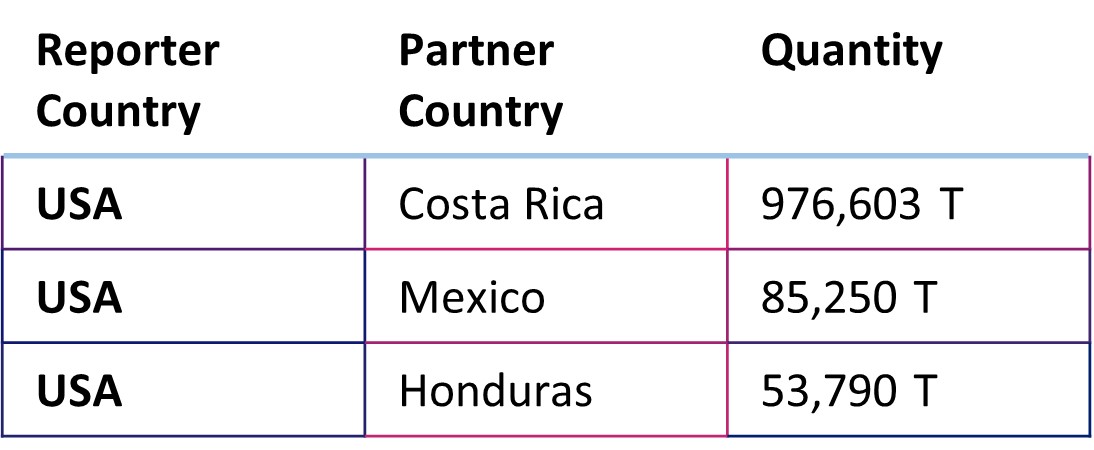
Table 1. United States Pineapple Import Reocrds (intentionally incomplete for simplicity)  Figure C: Tier 1 trade network for pineapples purchased in the USA.
As Figure C shows, the United States has 3 countries that it is sourcing pineapples from, in addition to its domestic supply. After creating the first tier of the network, each node (including the root node) is assigned a portion of the total supply. Total supply is the sum of domestic production and all imports:
Total Supply = Domestic Supply + Imports
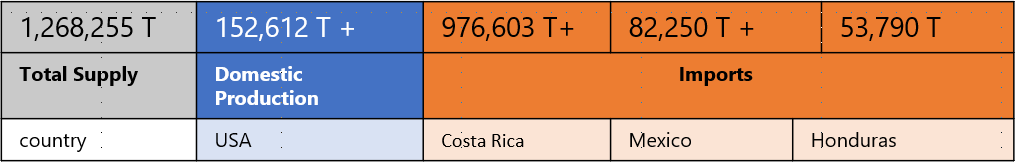 Table 2: United States Pineapple total supply breakdown
With tier 1 established, we then assess each of the child/supplier nodes the same way we did the root: is their supply primarily domestic production, or do they import a significant portion of their supply. This process is repeated recursively until all branches in the network terminate at a nation that predominantly produces the commodity, importing little to none of it. It will often be the case that none of the tier-1 suppliers are importing anything, and the final network will resemble Figure 1. But the network can often expand to a second, and even third tier in rare cases based on production and trade between nations. One of the unique features of this models is the ability to account for ‘broker nations’—those nations that import and re-export commodities. Identified production regions can then be analyzed with global or national production maps to allocate the exported production of interest to subnational regions in a producing country, giving a probable supply chain map.