Issue Scoring & Priority Levels
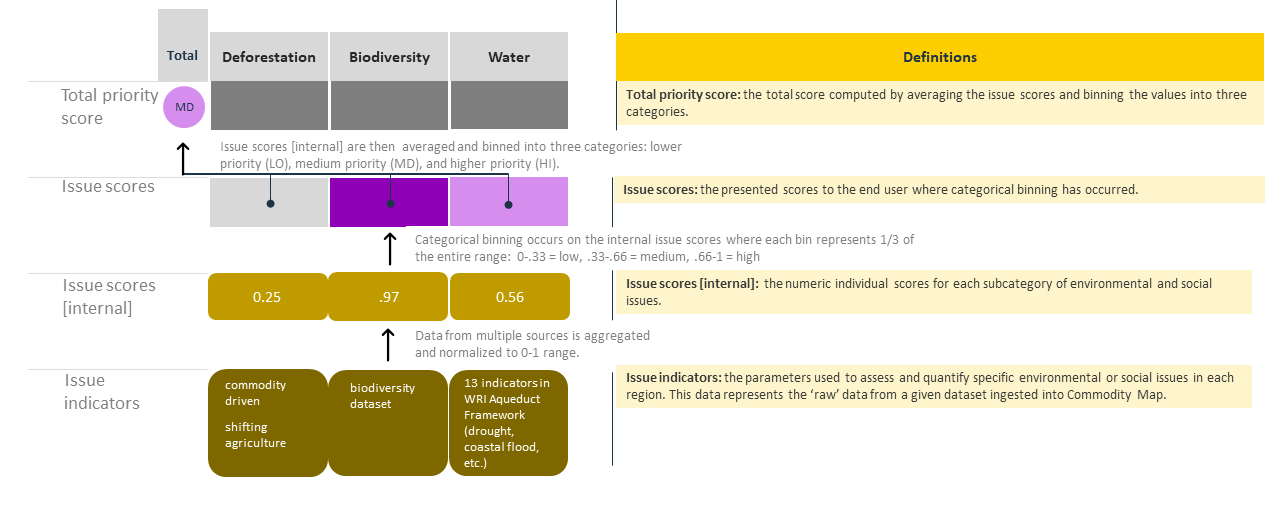
Beginning at the bottom of image below, multiple data transformations are performed starting with the raw input datasets–what we call issue indicators–to the total priority score displayed in the final analysis for a given commodity supply.
-
STEP 1 Transform issue indicators (raw datasets) to issue scores [internal]: to generate issue scores for a given supply, the spatial intersection of the crop production and issue indicator datasets (e.g. deforestation, biodiversity, water, etc.) is analyzed and quantified into a set of raw scores. These raw scores are termed issue indicators–parameters used to assess and quantify specific environmental or social issues in each region. This raw data is aggregated and normalized to a 0-1 range. For example, the water score is actually derived from 13 different indicators of water stress. This aggregated and normalized data are called internal issue scores.
-
STEP 2: Transform internal issue scores to those presented by CommodityMap (high, medium, low issue scores): categorical binning occurs on the internal issue scores where each bin represents 1/3 of the entire 0 to 1 range: 0-.33 = low, .33-.66 = medium, .66-1 = high. The data is then presented as heat maps to the user whereby low is represented as gray, medium as light purple, and high as dark purple. We call this data presented issue scores.
-
STEP 3: Transform the internal issue scores to total priority score. the final step is to average the internal indicator scores then perform categorical binning as performed in step 2 to derive the total priority score. The total priority score uses the same heat map colors as the presented issue scores. Additional, an abbreviation for low (LO), medium (MD), and high (HI) is displayed within the total priority circle.